Class Subject Grade Performance
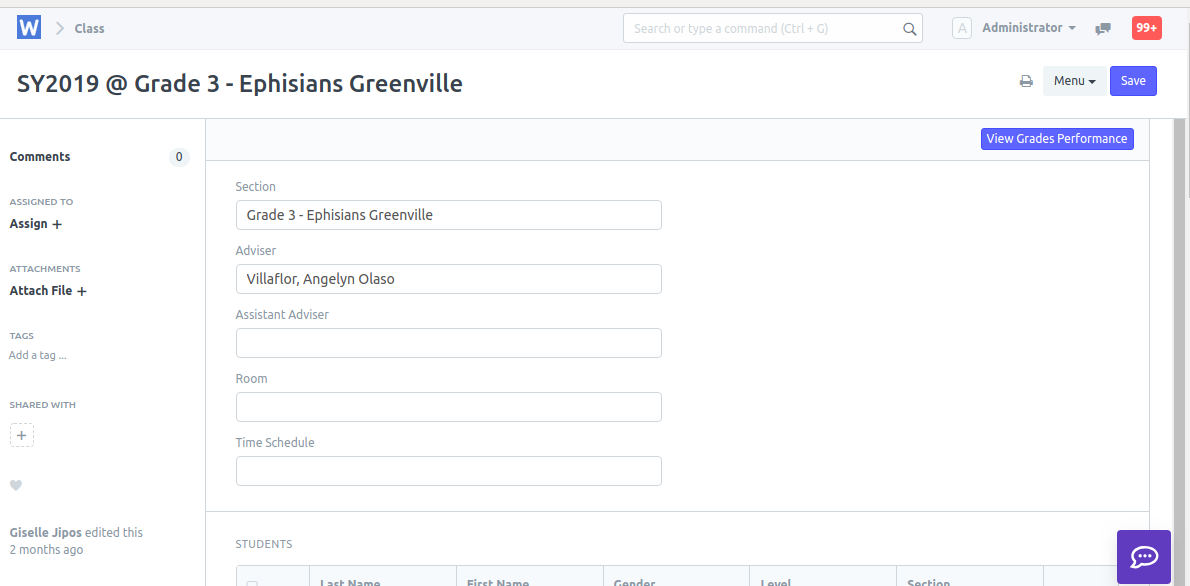
- Go to Class List to View Grades Performance Trend
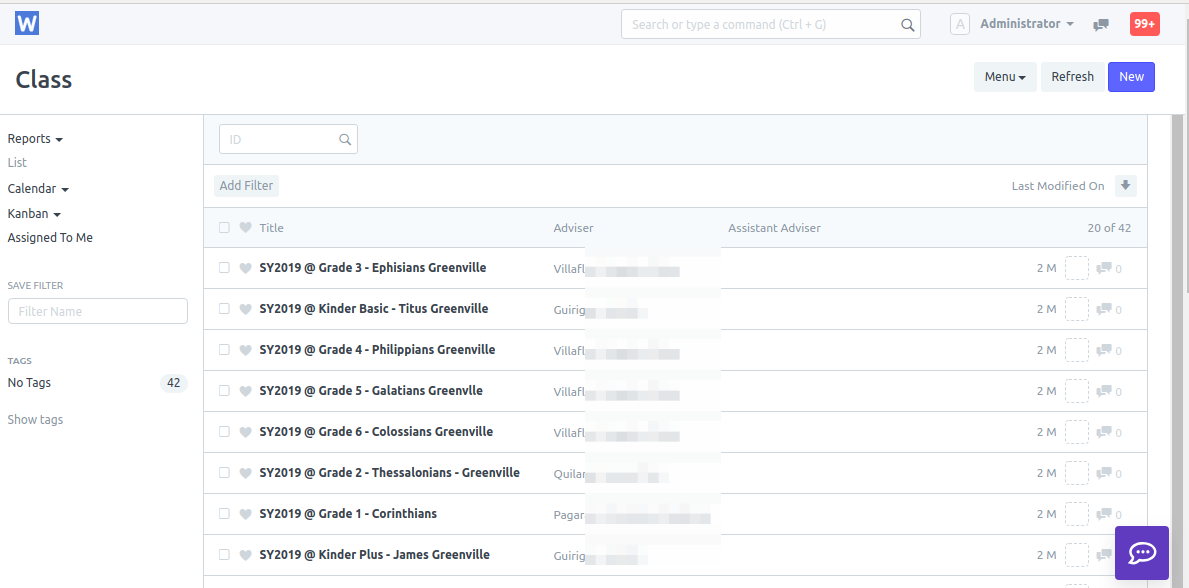
- Click View Grades Performance to open Analytics
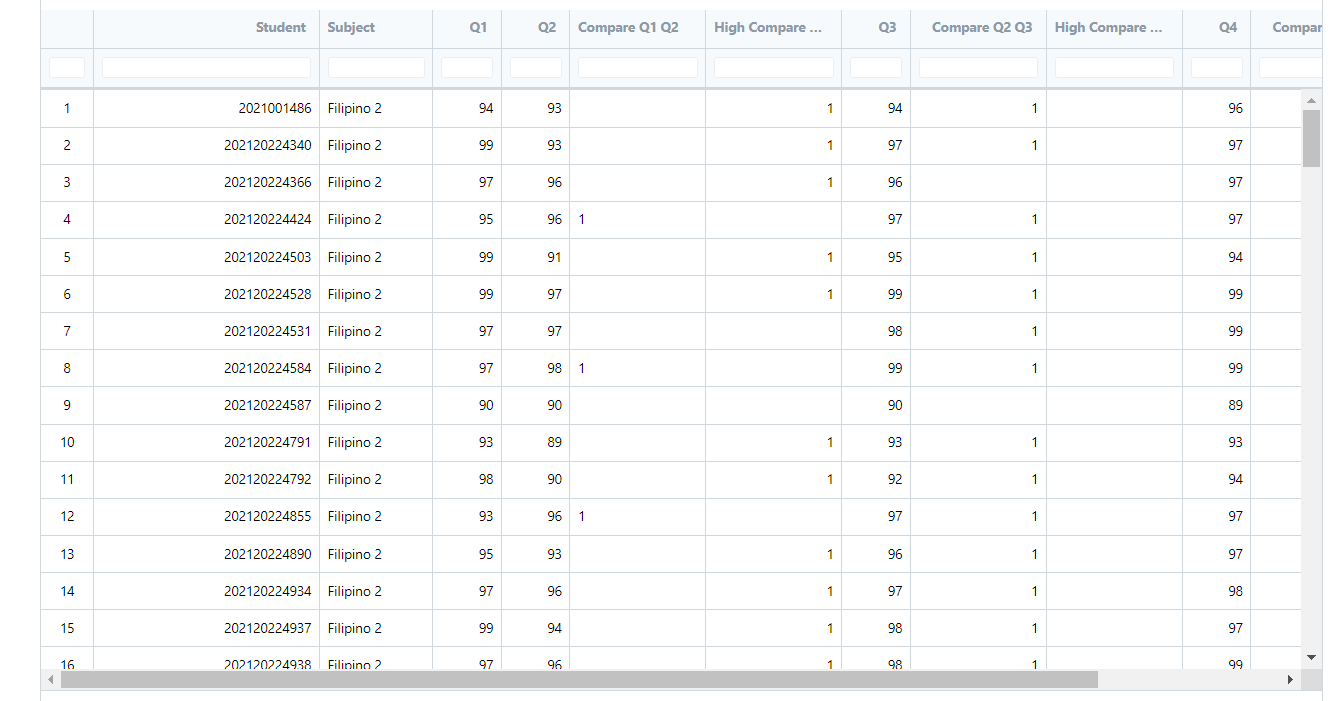
Count how many students whose grades on a particular subject is decreasing or increasing in every quarter
- Filter School Year and Subject
- Check Low or High or check both
- Chart Type: Bar or Line
- Report Type: Qtrly Subj Grades
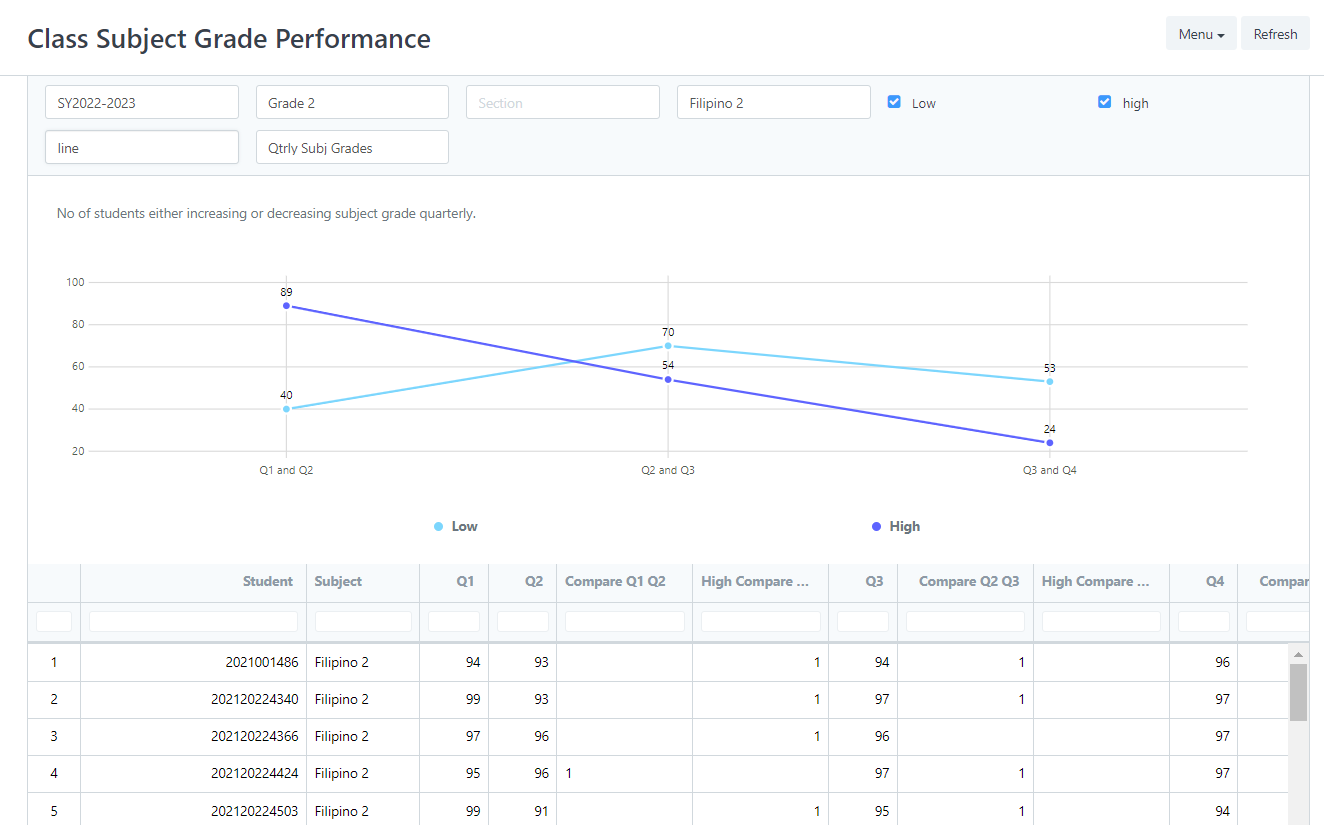
No of students either increasing or decreasing subject grade quarterly.
For this report to work, need to have at least two (2) quarters of grades in a particular subject. Example: First Quarter and Second Quarter Grades of English 1 of any Class
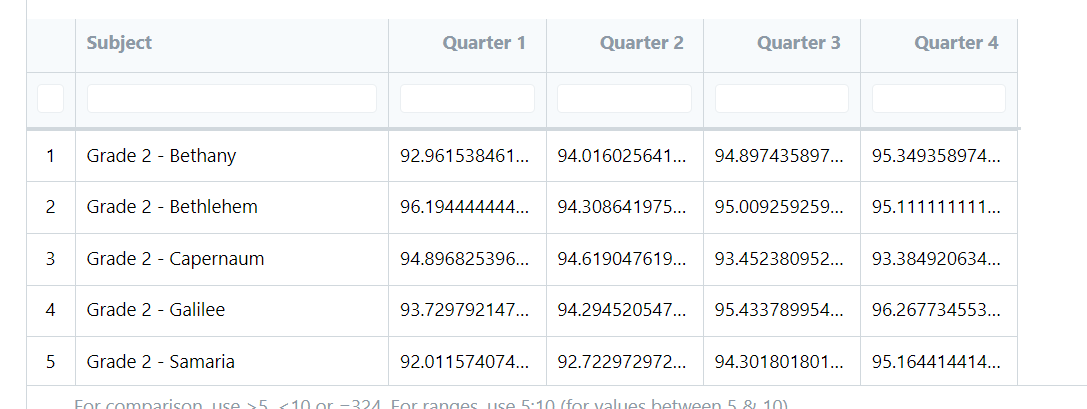
Comparison of classes/sections’ Average Quarterly Grade (Average of All Subjects) per grade level
- Filter School Year and Level
- Chart Type: Bar or Line
- Report Type: Avg Grade per Class
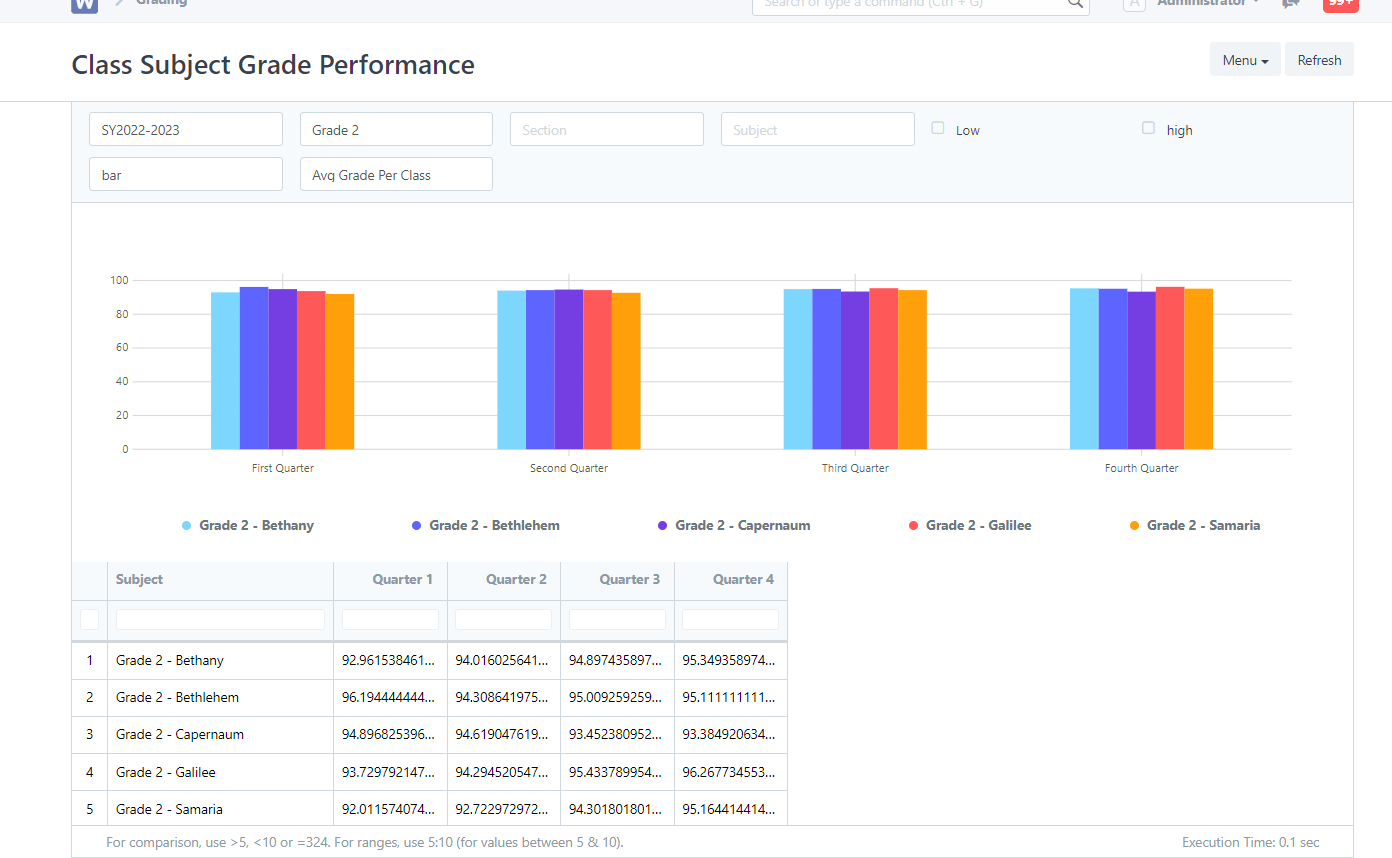
For this report to work:
- should have at least two (2) classes/sections
- Students under the two(2) sections should have complete grades. Example: If the school has 5 subjects, there should be grades for the 5 subjects from the First Quarter to the Fourth Quarter.
- OR At least two (2) Quarter of Complete Subject Grades
Yearly comparison of a particular Subject Grade based on Average Grade per Grade Level/Class
- Filter Level and Subject
- Chart Type: Bar or Line
- Report Type: Final Avg Yearly
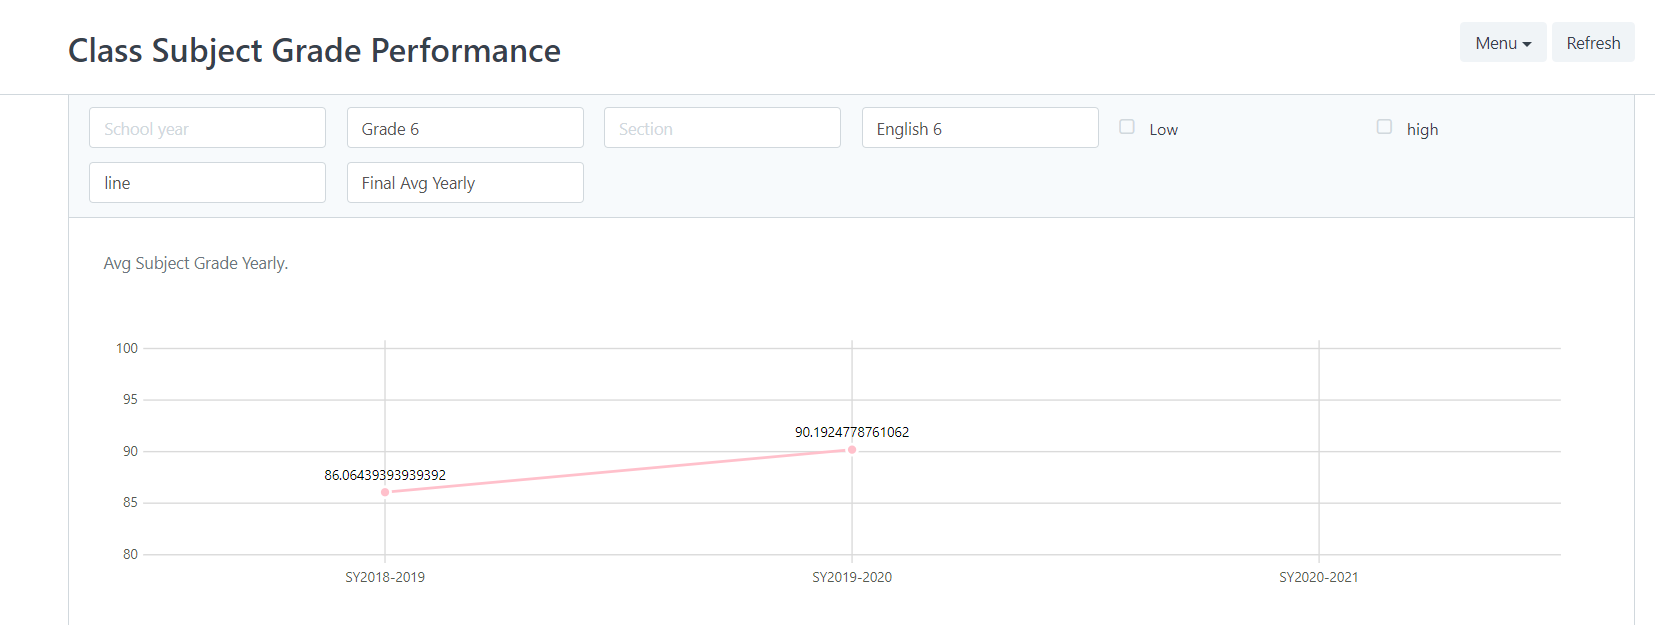
For this report to work:
- should have at least two (2) classes/sections. One (1) class for a particular Year and another class for another Year. Example: Grade 1 - Mango 2018 and Grade 1 - Mango 2019
- Students under a particular class of a particular Grade Level should have complete grades of a Particular subject from the First Quarter to the Fourth Quarter. Example: from First Quarter to the Fourth Quarter of English 1 of Grade 1 - Mango 2018 and Grade 1 - Mango 2019
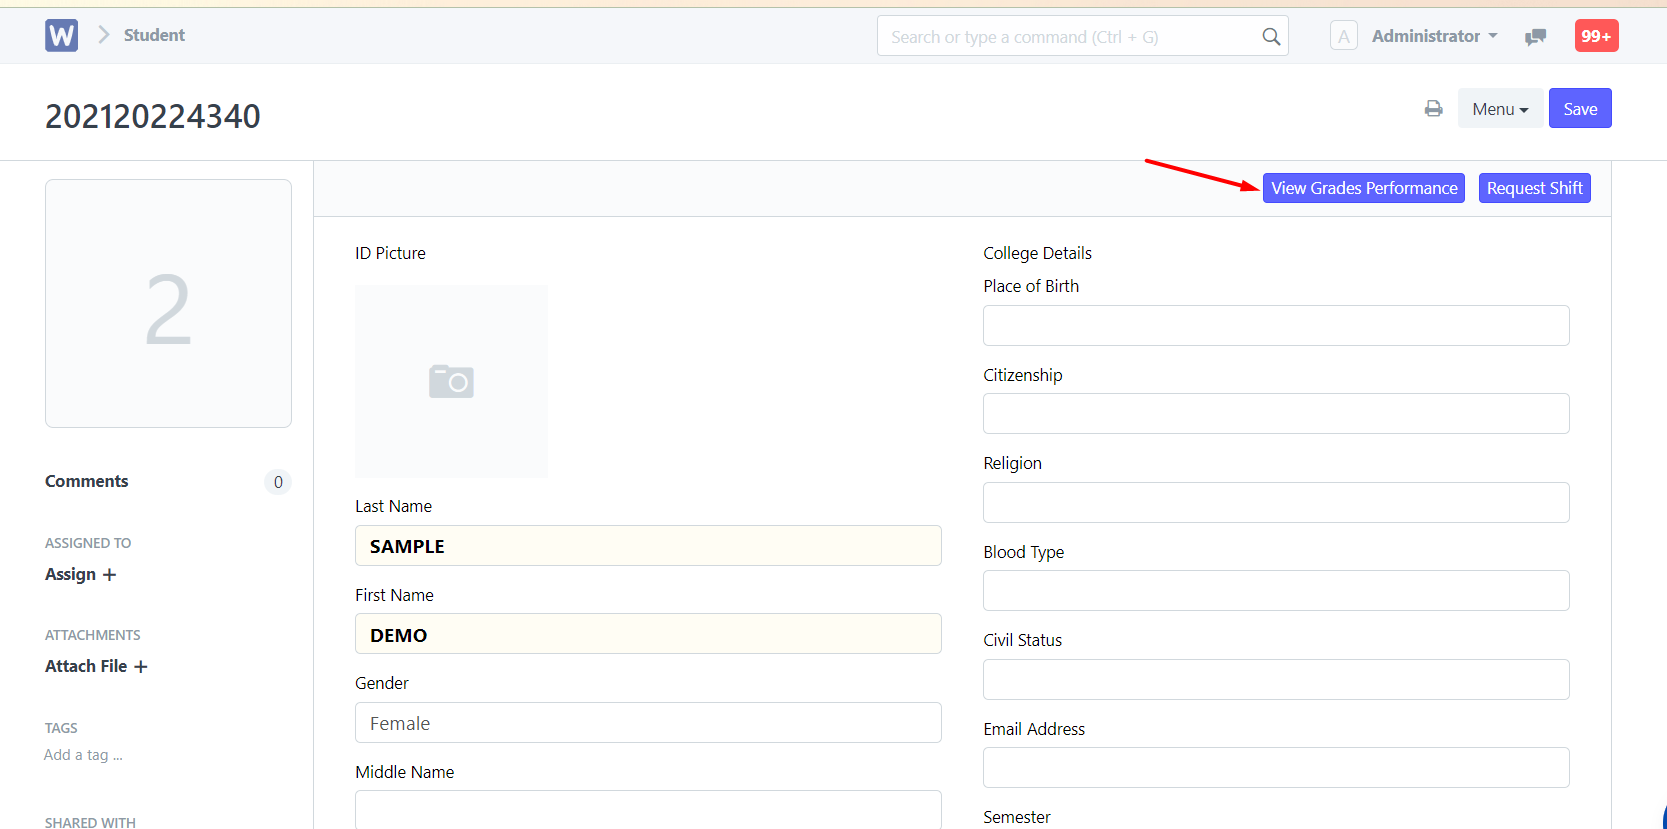
Student Subject Grade Performance
- Go to Student List and select Student
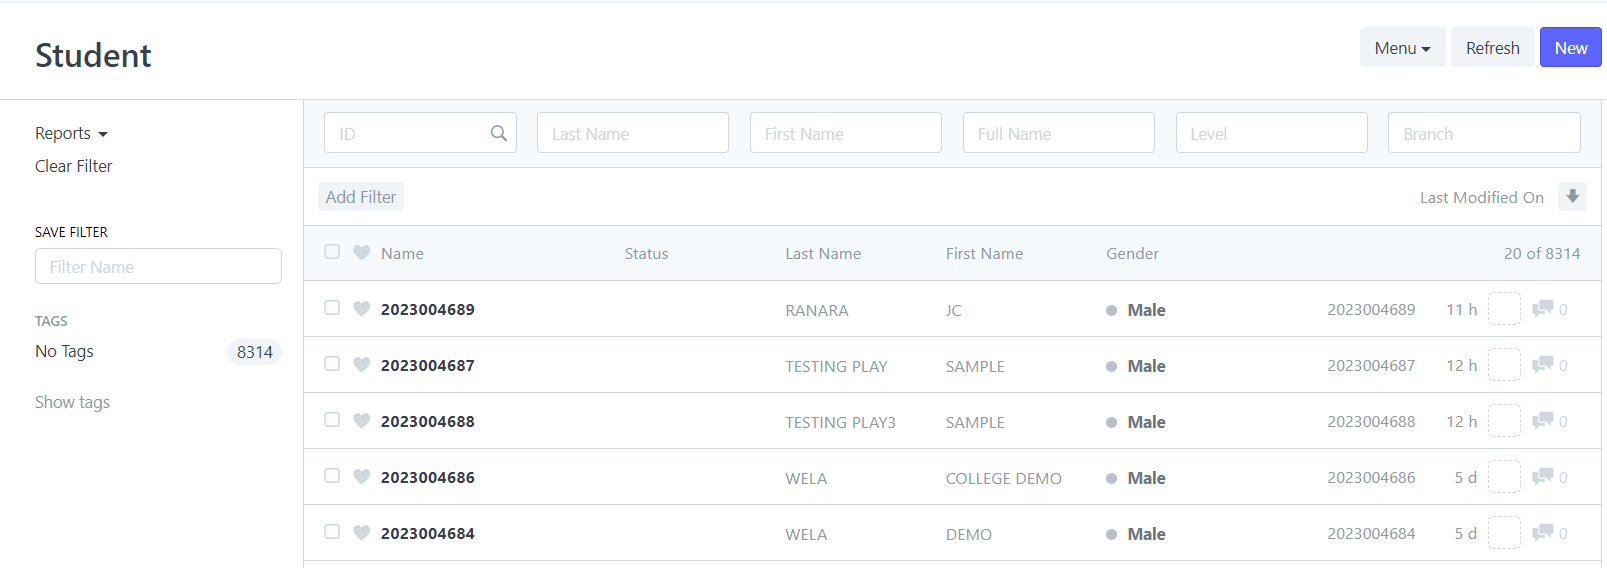
- Click View Grade Performance to open Analytics
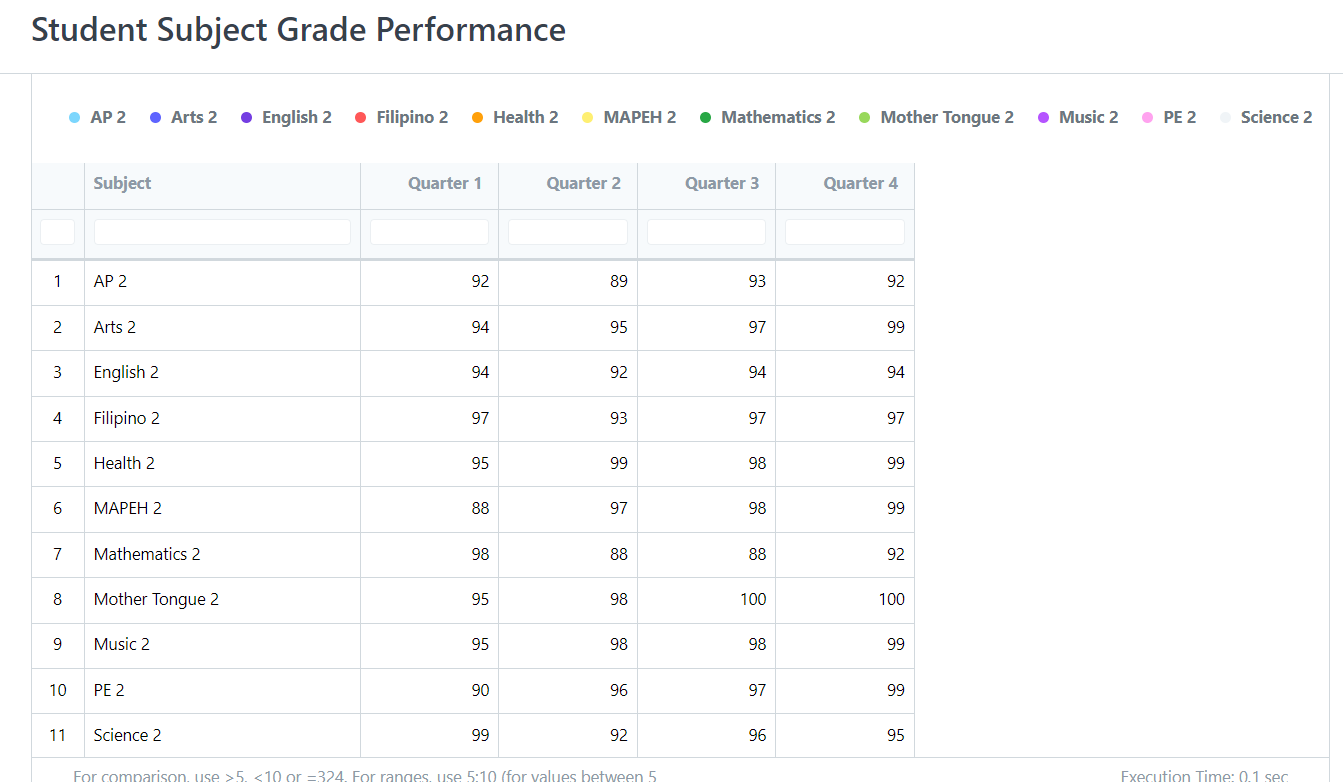
All Subjects Grade Performance Trend of a particular Student
- Filter School Year and Student Name
- Chart Type: Bar or Line
- Report Type: Qtrly Subj Grades
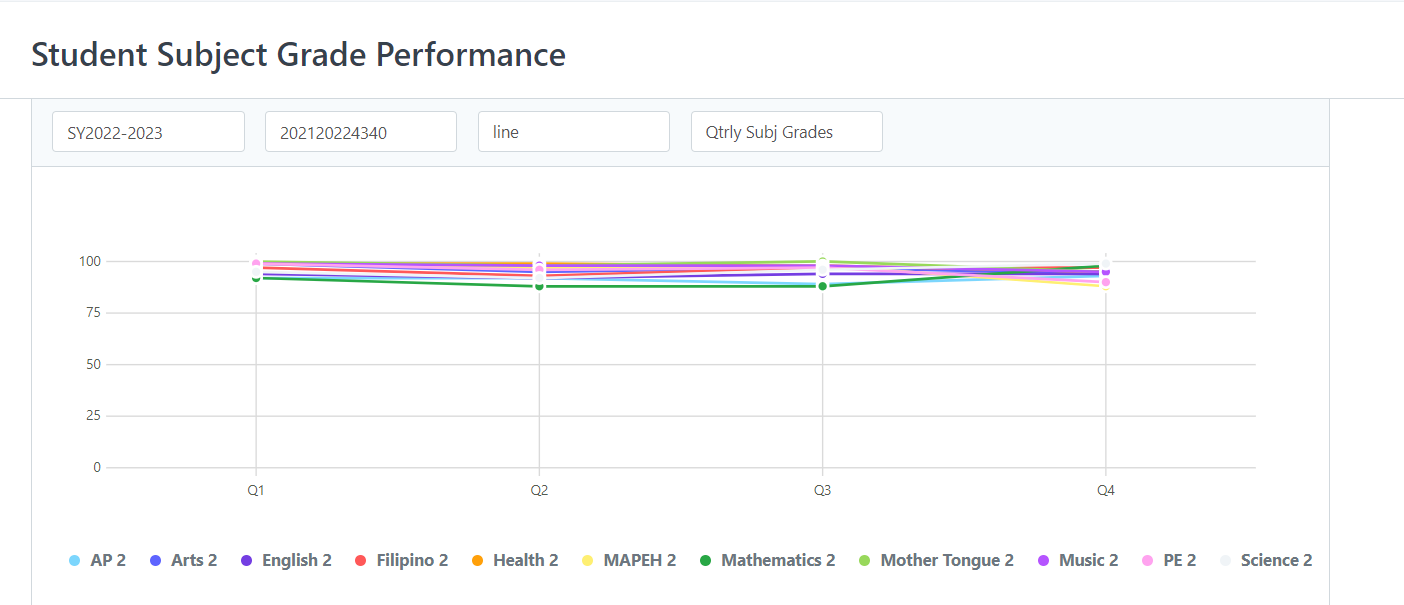
In order for report to work, a particular student should have complete grades of at least two (2) Quarters. Ex. If the school has 5 subjects, a particular student should have grades of the 5 subjects of at least First and Second Quarter.
Quarterly Average Performance Trend of a Particular Student
- Filter School Year and Student Name
- Chart Type: Bar or Line
- Report Type: Avg Qtrly Grades
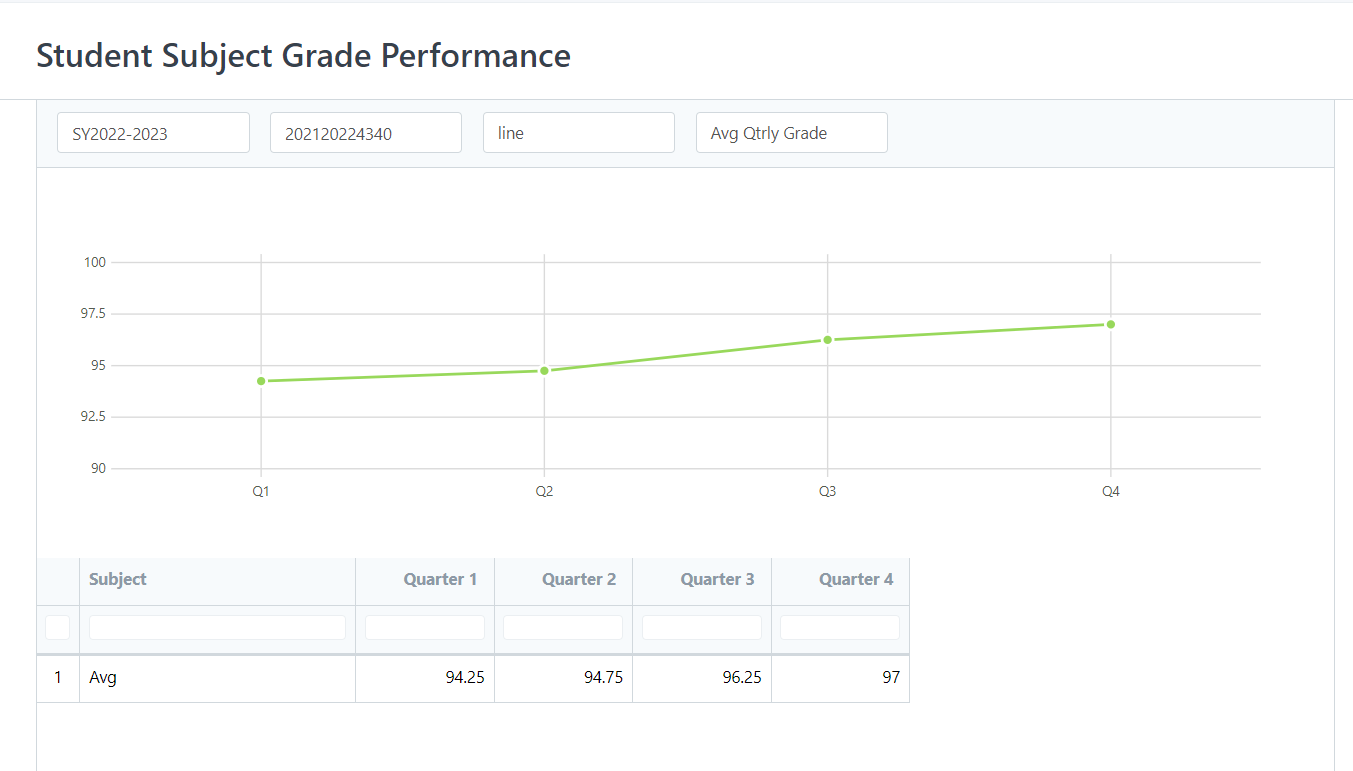
In order for the report to work, a particular student should have complete grades of at least two (2) Quarters. Ex. If the school has 5 subjects, a particular student should have grades of the 5 subjects of at least the First and Second Quarter.
Yearly Performance Trend of a Particular Student based on Final Average per School Year
- Filter Student Name
- Chart Type: Bar or Line
- Report Type: Final Avg Yearly
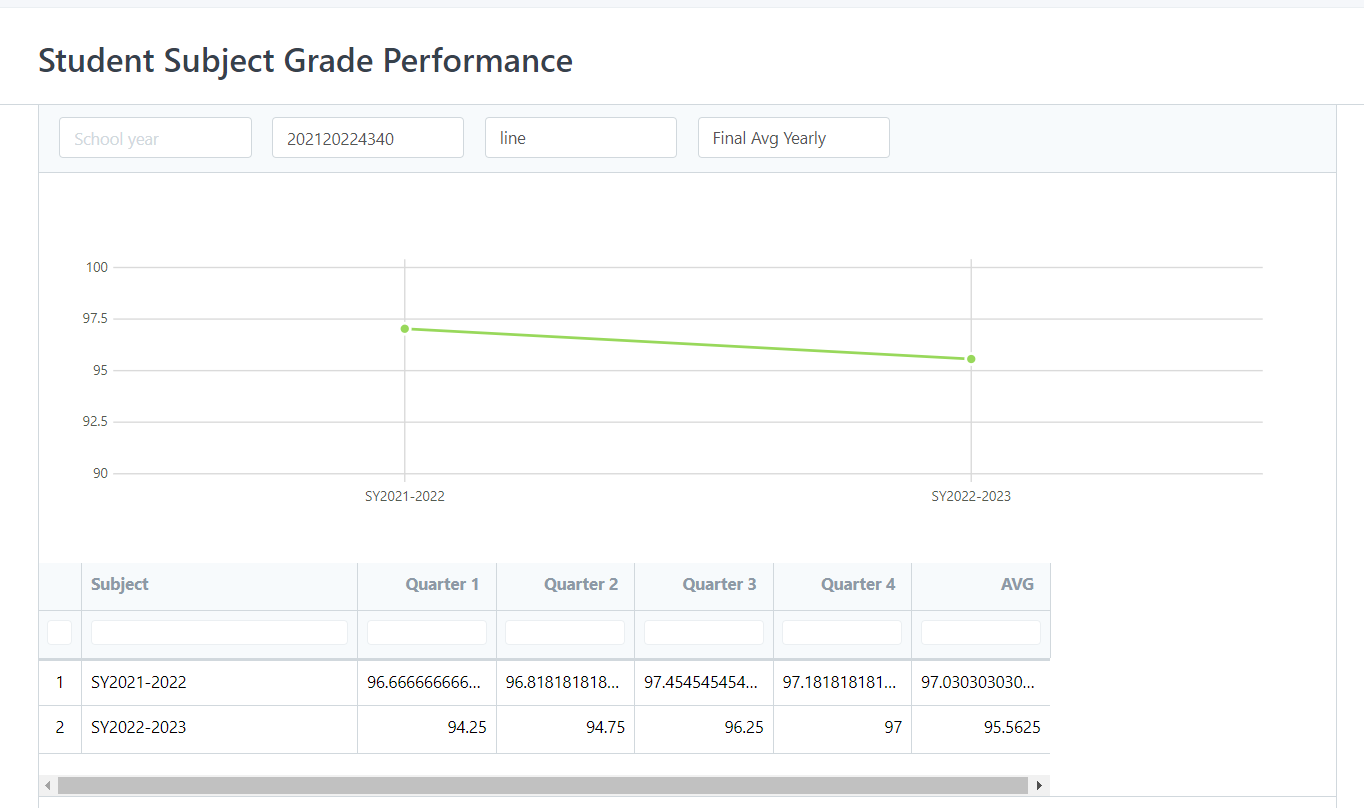
In order for the report to work, a particular student should have complete grades from First to Fourth Quarter for at least two years. Ex. If the school has 5 subjects, a particular student should have grades of the 5 subjects from First to Fourth Quarter of at least two years SY 2018-2019 and SY 2019-2020